top of page
Create Your First Project
Start adding your projects to your portfolio. Click on "Manage Projects" to get started
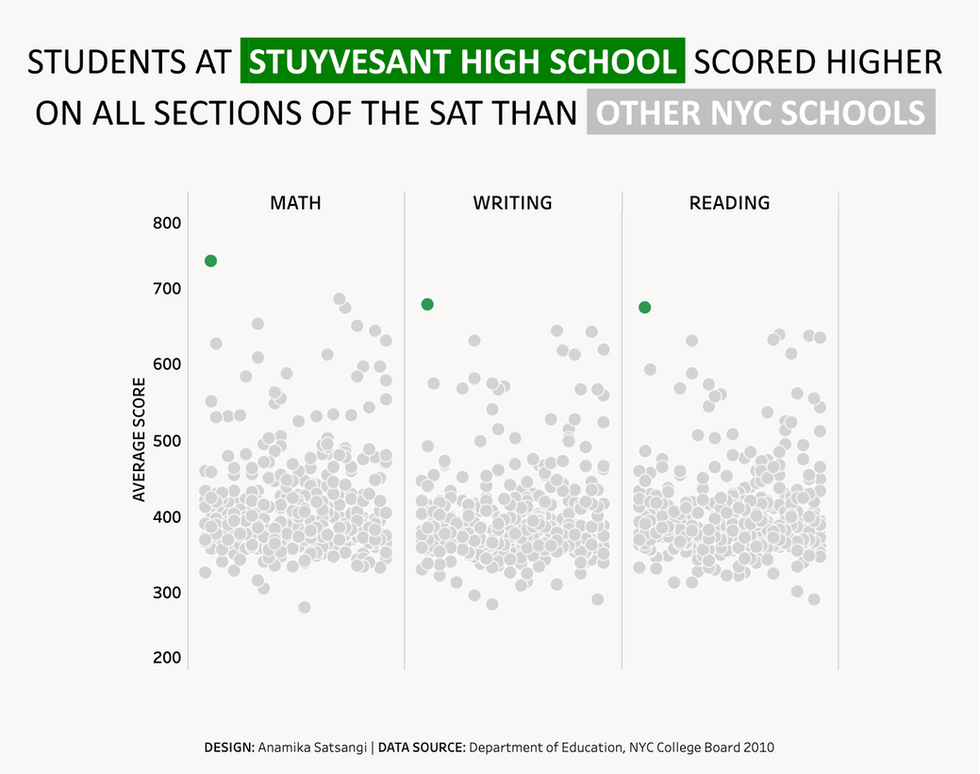
SAT SCORES IN NYC
I created this for a #BackToBasics Tableau project, where one story immediately stood out: students at one particular school outperformed all others in the city across all three SAT sections. I used color in the title and the scatterplot to draw attention to the standout school.


bottom of page